CAVITATION AND BUBBLE DYNAMICS
by Christopher Earls Brennen © Oxford University Press 1995
CHAPTER 4.
DYNAMICS OF OSCILLATING BUBBLES
4.1 INTRODUCTION
The focus of the two preceding chapters was on the dynamics of the growth and collapse of a single bubble experiencing one period of tension. In this chapter we review the response of a bubble to a continuous, oscillating pressure field. Much of the material comes within the scope of acoustic cavitation, a subject with an extensive literature that is reviewed in more detail elsewhere (Flynn 1964; Neppiras 1980; Plesset and Prosperetti 1977; Prosperetti 1982, 1984; Crum 1979; Young 1989). We include here a brief summary of the basic phenomena.
One useful classification of the subject uses the magnitude of the bubble radius oscillations in response to the imposed fluctuating pressure field. Three regimes can be identified:
- For very small pressure amplitudes the response is linear. Section 4.2 contains the first step in any linear analysis, the identification of the natural frequency of an oscillating bubble.
- Due to the nonlinearities in the governing equations, particularly the Rayleigh-Plesset Equation 2.12, the response of a bubble will begin to be affected by these nonlinearities as the amplitude of oscillation is increased. Nevertheless the bubble may continue to oscillate stably. Such circumstances are referred to as ``stable acoustic cavitation'' to distinguish them from those of the third regime described below. Several different nonlinear phenomena can affect stable acoustic cavitation in important ways. Among these are the production of subharmonics, the phenomenon of rectified diffusion, and the generation of Bjerknes forces. Each of these is described in greater detail later in the chapter.
- Under other circumstances the change in bubble size during a single cycle of oscillation can become so large that the bubble undergoes a cycle of explosive cavitation growth and violent collapse similar to that described in the preceding chapter. Such a response is termed ``transient acoustic cavitation'' and is distinguished from stable acoustic cavitation by the fact that the bubble radius changes by several orders of magnitude during each cycle.
Though we imply that these three situations follow with increasing amplitude,
it is important to note that other factors are important in
determining the kind of response that will occur for a given oscillating
pressure field. One of the factors is the relationship between the
frequency, ω, of the imposed oscillations and the natural
frequency, ωN, of the bubble. Sometimes this is characterized
by the relationship between the equilibrium radius of the bubble, RE,
in the absence of pressure oscillations and the size of the hypothetical
bubble, RR, which would resonate at the imposed frequency, ω.
Another important factor in determining whether the response is stable
or transient is the relationship between the pressure oscillation
amplitude,  , and the mean pressure,
  ∞. For
example, if
 <
<  ∞, the bubble is never placed under tension
and will therefore never cavitate. A related factor that will
affect the response is whether the
bubble is predominantly vapor-filled or gas-filled.
Stable oscillations are more likely with
predominantly gas-filled bubbles while bubbles which contain mostly vapor
will more readily exhibit transient acoustic cavitation.
We begin, however, with a discussion of the small-amplitude, linear response of a bubble to oscillations in the ambient pressure.
4.2 BUBBLE NATURAL FREQUENCIES
The response of a bubble to oscillations in the pressure at infinity will now be considered. Initially we shall neglect thermal effects and the influence of liquid compressibility. As discussed in the next section both of these lead to an increase in the damping above that represented by the viscous terms, which are retained. However, both can be approximately represented by increases in the damping or the ``effective'' viscosity.
Consider the linearized dynamic solution of Equation 2.27
when the pressure at infinity consists of a mean value,
 ∞, upon which is superimposed a small
oscillatory pressure of amplitude,
  ,
and radian frequency, ω, so that
 | ......(4.1) |
 | ......(4.2) |
 ∞, and the bubble radius response,
 ,
will in general be a complex number such that
RE|
 | is the amplitude of the bubble
radius oscillations.
The phase of
  represents the phase difference between
p∞
and R.
For the present we shall assume that the mass of gas in the bubble,
mG, remains constant.
Then substituting Equations 4.1 and 4.2 into
Equation 2.27,
neglecting all terms of order |  |2 and using the
equilibrium condition 2.41 one finds
 | ......(4.3) |
 | ......(4.4) |
 , the maximum
or peak response amplitude occurs at a frequency,
ωP, given by the minimum value of the spectral
radius of the left-hand side of Equation 4.3:
 | ......(4.5) |
 ∞-pV) rather than
pGE:
 | ......(4.6) |
 | ......(4.7) |
It is also convenient for future purposes to define the natural frequency, ωN, of oscillation of the bubbles as the value of ωP for zero damping:
 | ......(4.8) |
 ∞)>4S/3RE
(for isothermal gas behavior, k=1); stable
oscillations can only occur about a stable equilibrium.
The peak frequency, ωP, is an important quantity to consider in any
bubble dynamic problem.
Note from Equation 4.6 that ωP is a function only of
( ∞-pV), RE, and the
liquid properties.
Typical graphs for ωP as a function of RE for
several (
 ∞-pV) values are shown in
Figures 4.1 and 4.2
for water at 300°K (S=0.0717, μL=0.000863,
ρL=996.3) and for sodium at 800°K
(S=0.15, μL=0.000229, ρL=825.8).
As is evident from Equation 4.6, the second and third
terms on the right-hand side dominate at very small RE
and the frequency is almost independent of
(
 ∞-pV).
Indeed, no peak frequency exists below a size equal to about
2νL2ρL/S. For larger bubbles the
viscous term becomes
negligible and ωP depends on
(
 ∞-pV).
If the latter is positive, the natural frequency approaches
zero like RE-1. In the case of tension,
pV>
 ∞,
the peak frequency does not exist above RE=RC.
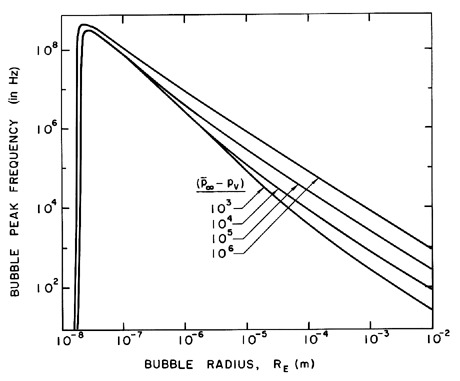
|
Figure 4.1
Bubble resonant frequency in water at 300°K
(S=0.0717, μL=0.000863, ρL=996.3)
as a function of the radius
of the bubble for various values of
( ∞-pV) as indicated. ∞-pV) as indicated.
|
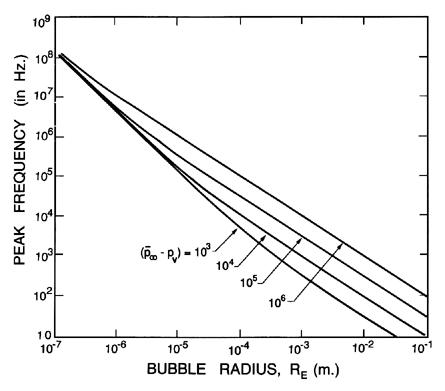
|
Figure 4.2
Bubble resonant frequency in sodium at
800°K (S=0.15, μL=0.00023, ρL=825.8) as a function of the
radius of the bubble for various values of
( ∞-pV) as indicated. ∞-pV) as indicated.
|
It is important to take note of the fact that for the typical nuclei commonly found in water, which lie in range 1 to 100μm, the natural frequencies are of the order, 5 to 25kHz. This has several important practical consequences. First, if one wishes to cause cavitation in water by means of an acoustic pressure field, then the frequencies that will be most effective in producing a substantial concentration of large cavitation bubbles will be in this frequency range. This is also the frequency range employed in magnetostrictive devices used to oscillate solid material samples in water (or other liquid) in order to test the susceptibility of that material to cavitation damage (Knapp et al. 1970). Of course, the oscillation of the nuclei produced in this way will be highly nonlinear; nevertheless, the peak response frequency will be less than but not radically different from the peak response frequency for small linear oscillations.
It is also important to note that, like any oscillator, a nucleus
excited at its resonant frequency, ωP,
will exhibit a response whose amplitude is primarily a
function of the damping.
Since the viscous damping is rather small in many practical
circumstances, the amplitude given by Equation 4.7 can be very
large due to the factor μL in the denominator.
It could be heuristically argued that this might cause the
nucleus to exceed its critical size, RC
(see Section 2.5), and that highly nonlinear behavior
with very large amplitudes would result.
The pressure amplitude,  C, required to achieve
RE|
 |=RC-RE
can be readily evaluated from Equation 4.7 and the results of the
last section:
 | ......(4.9) |
4.3 EFFECTIVE POLYTROPIC CONSTANT
At this juncture it is appropriate to discuss the validity of the assumption that the gas in the bubble behaves polytropically according to Equation 2.26. For the circumstances of bubble growth and collapse considered in Chapter 2 the polytropic assumption is usually considered acceptable for the following reasons. First, during the growth of a vapor bubble the gas plays a relatively minor role, and the preponderance of vapor will tend to determine the bubble temperature. Second, during the later stages of collapse when the gas predominates, the velocities are so high that an adiabatic assumption, k=γ, seems appropriate. Since a collapsing bubble loses its spherical symmetry, the resulting internal motions of the gas would, in any case, generate mixing, which would tend to negate any more sophisicated model based on spherical symmetry.
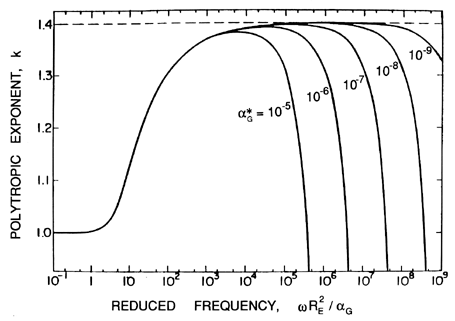
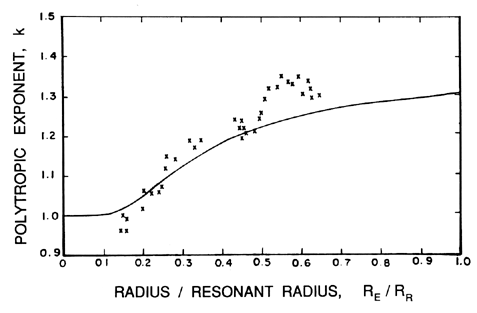
The issue of the appropriate polytropic constant is directly coupled with the evaluation of the effective thermal damping of the bubble and was first addressed by Pfriem (1940), Devin (1959), and Chapman and Plesset (1971). Prosperettti (1977b) analysed the problem in detail with particular attention to thermal diffusion in the gas and predicted the effective polytropic exponents shown in Figure 4.3. In that figure the effective polytropic exponent is plotted against a reduced frequency, ωRE2/αG, for various values of a nondimensional thermal diffusivity in the gas, αG*, defined by
 | ......(4.10) |
|
|
Prosperetti, Crum, and Commander (1988) summarize the current understanding of the theory in which
 | ......(4.11) |
 , is given by
 | ......(4.12) |
 }.
}.
While the use of an effective polytropic exponent (and the associated thermal damping given by Equation 4.15) provides a consistent approach for linear oscillations, Prosperetti, Crum, and Commander (1988) have shown that it may cause significant errors when the oscillations become nonlinear. Under these circumstances the behavior of the gas may depart from that which is consistent with an effective polytropic exponent, and there seems to be no option but to numerically solve the detailed mass, momentum, and energy equations in the interior of the bubble.
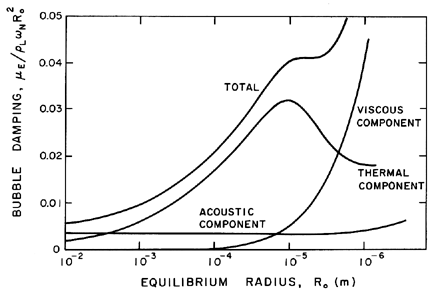
Chapman and Plesset (1971) have presented a useful summary of the three primary contributions to the damping of bubble oscillations, namely that due to liquid viscosity, that due to liquid compressibility through acoustic radiation, and that due to thermal conductivity. It is particularly convenient to represent the three components of damping as three additive contributions to an effective liquid viscosity, μE, which can then be employed in the Rayleigh-Plesset equation in place of the actual liquid viscosity, μL :
 | ......(4.13) |
 | ......(4.14) |
 | ......(4.15) |
 is given by Equation 4.12.
The relative magnitudes of the three components of damping (or ``effective" viscosity) can be quite different for different bubble sizes or radii, RE. This is illustrated by the data for air bubbles in water at 20°C and atmospheric pressure that is taken from Chapman and Plesset (1971) and reproduced as Figure 4.5. Note that the viscous component dominates for very small bubbles, the thermal component is dominant for most bubbles of practical interest, and the acoustic component only dominates for bubbles larger than about 1cm.
|
The preceding sections assume that the perturbation in the bubble radius,
 , is sufficiently small so that the linear approximation holds.
However, as Plesset and Prosperetti (1977) have detailed in their review of
the subject, single bubbles exhibit a number of interesting and important
nonlinear phenomena. When a liquid that will inevitably contain microbubbles
is irradiated with sound of a given frequency, ω, the nonlinear
response results in harmonic dispersion, which not only produces harmonics
with frequencies that are integer multiples of ω
(superharmonics) but, more unusually, subharmonics
with frequencies
less than ω of the form mω/n where m and n are
integers. Both the superharmonics and subharmonics become more prominent as
the amplitude of excitation is increased.
The production of subharmonics was first observed experimentally
by Esche (1952), and possible origins of this nonlinear effect were
explored in detail by Noltingk and Neppiras (1950, 1951),
Flynn (1964), Borotnikova and Soloukin (1964), and
Neppiras (1969), among others. Neppiras (1969) also surmised that subharmonic
resonance could evolve into transient cavitation.
These analytical and numerical investigations use
numerical solutions of the Rayleigh-Plesset equation to explore
the nonlinear characteristics of a single bubble excited by
an oscillating pressure with a single frequency, ω.
As might be expected, different kinds of response occur
depending on whether ω is greater or less than the natural
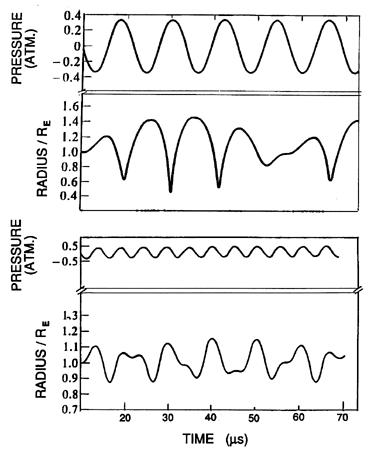
frequency of the bubble, ωN. Figure 4.6 presents two
examples of the kinds of response encountered, one for
ω<ωN and the other for
ω>ωN. Note the
presence of subharmonics in both cases.
|
Figure 4.6
Numerically computed examples of the steady nonlinear radial
oscillations of a bubble excited
by the single-frequency pressure oscillations shown at the top of each graph.
Top: Subresonant excitation at 83.4kHz or ω/ωN=0.8 with
an amplitude,  =0.33bar. Bottom: Superresonant excitation of
a bubble of mean radius 26μm at
191.5kHz or ω/ωN=1.8 with an amplitude =0.33bar. Bottom: Superresonant excitation of
a bubble of mean radius 26μm at
191.5kHz or ω/ωN=1.8 with an amplitude
 =0.33bar.
Adapted from Flynn (1964). =0.33bar.
Adapted from Flynn (1964).
|
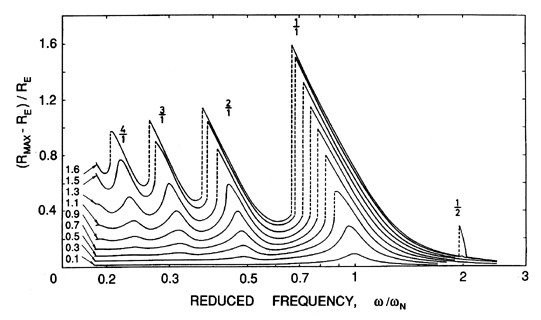
Lauterborn (1976) examined numerical solutions for a large number of different excitation frequencies and was able to construct frequency response curves of the kind shown in Figure 4.7. Notice the progressive development of the peak responses at subharmonic frequencies as the amplitude of the excitation is increased. Nonlinear effects not only create these subharmonic peaks but also cause the resonant peaks (both the main resonance near ω/ωN=1 and the subharmonic resonances) to be skewed to the left, creating the discontinuities indicated by the dashed vertical lines. These correspond to bifurcations or sudden transitions between two valid solutions, one with a much larger amplitude than the other. Prosperetti (1977a) has provided a theoretical analysis of these transitions.
|
 (in bar), as shown
on the left. The numbers above the peaks indicate the order of the
resonance, m/n. Adapted from Lauterborn (1976).
When the amplitudes of oscillation are large, there are no simple analytical methods available, and one must resort to numerical calculations such as those of Lauterborn (1976) in order to investigate the phenomena that result from nonlinearity. However, while the amplitudes are still fairly small, it is valid to use an expansion technique to investigate weakly nonlinear effects. Here we shall retain only terms that are quadratic in the oscillation amplitude; cubic and higher order terms are neglected.
To illustrate weakly nonlinear analysis and the frequency dispersion that results from this procedure, Equations 4.1 and 4.2 are rewritten as
 | ......(4.16) |
 | ......(4.17) |
 | ......(4.18) |
 denotes the complex conjugate of
  and
and
 | ......(4.19) |
 | ......(4.20) |
 | ......(4.21) |
 N given
 N and the parameters,
ν/ωNRE2,
S/ρLωN2RE3,
k, and δ.
The value of N should be large enough to encompass all the harmonics
with significant amplitudes.
We shall first examine the characteristics of the radial oscillations that
are caused by a single excitation frequency. It is clear from
the form of Equation 4.18 that, in this case, the only non-zero
 N occur
at frequencies that are integer multiples of the excitation frequency.
Consequently, for this class of problems we may chose δ to be
the excitation frequency; then
 1 is the amplitude
of that excitation and
 N=0 for n ≠ 1.
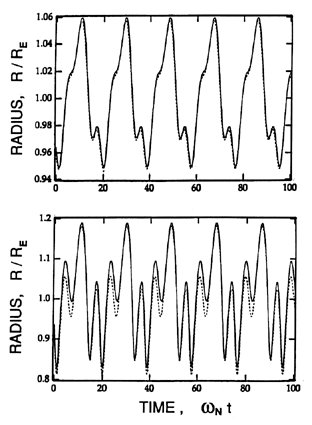
Figure 4.8 provides two comparisons between
the weakly nonlinear solutions and more exact numerical integrations of
the Rayleigh-Plesset equation. Clearly these will diverge as the
amplitude of oscillation is increased; nevertheless the examples in
Figure 4.8 show that the weakly nonlinear solutions are
qualitatively valuable.
|
Figure 4.8
Two comparisons between weakly nonlinear solutions and
more exact numerical calculations. The parameters are
νL/ωNRE2=0.01,
S/ρLωN2RE3=0.1, k=1.4,
and the excitation frequency is ωN /3. The upper figure
has a dimensionless excitation amplitude,
 1/ρLωN2RE2,
of 0.04 while the lower figure
has a value of 0.08. 1/ρLωN2RE2,
of 0.04 while the lower figure
has a value of 0.08.
|
Figure 4.9 presents examples of the values for
| N|
for three different amplitudes of excitation and demonstrates how the
harmonics become more important as the amplitude increases. In this
example, the frequency of excitation is ωN/6; the
prominence
of harmonics close to the natural frequency is characteristic of all
solutions in which the excitation frequency is less than
ωN.
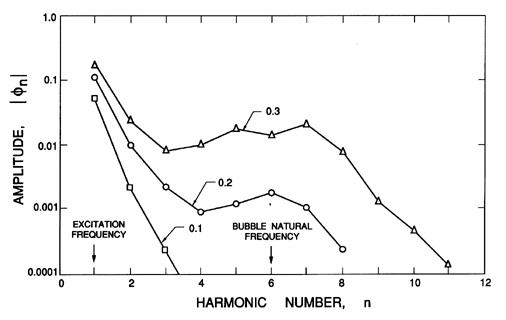
|
Figure 4.9
Example of the magnitude of the harmonics of radial motion,
|φN|, from Equation 4.18 with
νL/ωNRE2=0.01,
S/ρLωN2RE3=0.1,
k=1.4, an excitation frequency of ωN/6, and three
amplitudes of excitation,
 1/ρLωN2RE2,
as indicated. The connecting lines are for visual effect only. 1/ρLωN2RE2,
as indicated. The connecting lines are for visual effect only.
|
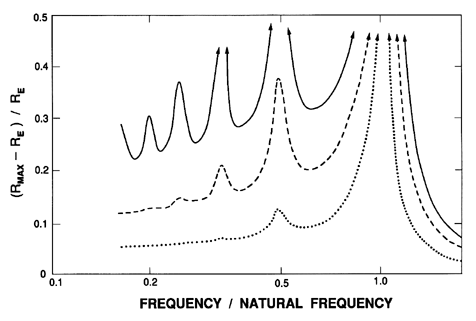
Weakly nonlinear solutions can also be used to construct frequency response spectra similar to those due to Lauterborn (1976) described in the preceding section. Figure 4.10 includes examples of such frequency response spectra obtained by plotting the maximum possible deviation from the equilibrium radius, (Rmax-RE)/RE, against the excitation frequency. For convenience we estimate (Rmax-RE)/RE as
 | ......(4.22) |
|
 1/ρLωN2RE2,
of 0.1 (dotted line),
0.2 (dashed line), and 0.3 (solid line).
The advantages of the weakly nonlinear analyses become more apparent when dealing with problems of more complex geometry or multiple frequencies of excitation. It is particularly useful in studying the interactions between bubbles in bubble clouds, a subject that is discussed in Chapter 6.
In recent years, the modern methods of nonlinear dynamical systems analysis have led to substantial improvement in the understanding of the nonlinear behavior of bubbles and of clouds of bubbles. Lauterborn and Suchla (1984) seem to have been the first to explore the bifurcation structure of single bubble oscillations. They constructed the bifurcation diagrams and strange attractor maps that result from a compressible Rayleigh-Plesset equation similar to Equation 3.1. Among the phenomena obtained was a period doubling sequence of a periodic orbit converging to a strange attractor. Subsequent studies by Smereka, Birnir, and Banerjee (1987), Parlitz et al. (1990), and others have provided further information on the nature of these chaotic, nonlinear oscillations of a single, spherical bubble. It remains to be seen how far real bubble systems that involve departures from spherical symmetry and from the Rayleigh-Plesset equation adhere to these complex dynamical behaviors.
In Section 6.10, we shall explore the linear, dynamic behavior of a cloud of bubbles and will find that such clouds exhibit their own characteristic dynamics and natural frequencies. The nonlinear, chaotic behavior of clouds of bubbles have also been recently examined by Smereka and Banerjee (1988) and Birnir and Smereka (1990), and these studies reveal a parallel system of bifurcations and strange attractors in the oscillations of bubble clouds.
4.8 THRESHOLD FOR TRANSIENT CAVITATION
We now turn to one of the topics raised in the introduction to this chapter: the distinction between those circumstances in which one would expect stable acoustic cavitation and those in which transient acoustic cavitation would occur. This issue was first addressed by Noltingk and Neppiras (1950, 1951) and is reviewed by Flynn (1964) and Young (1989), to which the reader is referred for more detail.
We consider a bubble of equilibrium size, RE, containing a mass of gas,
mG, and subjected to a mean ambient pressure,  ∞, with
a superimposed oscillation of frequency, ω, and amplitude,
 (see Equations 4.1 and 4.2). The first step
in establishing the criterion is accomplished by the static stability
analysis of Section 2.5. There we explored the stability
of a bubble when the pressure far from the bubble was varied and
identified a critical size, RC, and a critical threshold pressure,
p∞c, which, if reached, would lead to unstable bubble
growth and therefore, in the present context, to transient cavitation.
The added complication here is that there is only a finite time during
each cycle during which growth can occur, so one must address the
issue of whether or not that time is sufficient for significant unstable
growth.
The issue is determined by the relationship between the radian frequency,
ω, of the imposed oscillations and the natural frequency,
ωN, of the bubble. If
ω « ωN, then the liquid
inertia is relatively unimportant in the bubble dynamics and the bubble
will respond quasistatically. Under these circumstances the Blake
criterion (see Section 2.5)
will hold. Denoting the critical amplitude at which transient
cavitation will occur by  C, it follows that the critical
conditions will be reached when the minimum instantaneous pressure,
(
 ∞-
∞- ), just reaches the critical Blake
threshold pressure
given by Equation 2.45. Therefore
 | ......(4.23) |
 ∞-
∞- ). Moreover, the
pressure will be negative for some fraction of the period of
oscillation; that fraction is solely related to the parameter,
β= (1-
 ∞/
∞/ ) (Apfel 1981). Then,
assuming
that the quasistatic Blake threshold has been exceeded, the bubble
growth rate will be given roughly by the asymptotic growth rate of
Equation 2.33. Combining this with the time available for
growth, the typical maximum bubble radius, RM, will be given by
 | ......(4.24) |
 | ......(4.25) |
 | ......(4.26) |
We now shift attention to a different nonlinear effect involving the mass transfer of dissolved gas between the liquid and the bubble. This important nonlinear diffusion effect occurs in the presence of an acoustic field and is known as ``rectified mass diffusion'' (Blake 1949a). Analytical models of this phenomenon were first put forward by Hsieh and Plesset (1961) and Eller and Flynn (1965), and reviews of the subject can be found in Crum (1980, 1984) and Young (1989).
Consider a gas bubble in a liquid with dissolved gas as described in Section 2.6. Now, however, we add an oscillation to the ambient pressure. Gas will tend to come out of solution into the bubble during that part of the oscillation cycle when the bubble is larger than the mean because the partial pressure of gas in the bubble is then depressed. Conversely, gas will redissolve during the other half of the cycle when the bubble is smaller than the mean. The linear contributions to the mass of gas in the bubble will, of course, balance so that the average gas content in the bubble will not be affected at this level. However, there are two nonlinear effects that tend to increase the mass of gas in the bubble. The first of these is due to the fact that release of gas by the liquid occurs during that part of the cycle when the surface area is larger, and therefore the influx during that part of the cycle is slightly larger than the efflux during the part of the cycle when the bubble is smaller. Consequently, there is a net flux of gas into the bubble which is quadratic in the perturbation amplitude. Second, the diffusion boundary layer in the liquid tends to be stretched thinner when the bubble is larger, and this also enhances the flux into the bubble during the part of the cycle when the bubble is larger. This effect contributes a second, quadratic term to the net flux of gas into the bubble. Recent analyses, which include all of the contributing nonlinear terms (see Crum 1984 or Young 1989), yield the following modification to the steady mass diffusion result given previously in Equation 2.56 (see Section 2.6):
 | ......(4.27) |
 :
:
 | ......(4.28) |
 | ......(4.29) |
 | ......(4.30) |
 | ......(4.31) |
 | ......(4.32) |
 | ......(4.33) |
Strasberg (1961) first explored the issue of the conditions under which a bubble would grow due to rectified diffusion. Clearly, the sign of the bubble growth rate predicted by Equation 4.27 will be determined by the sign of the term
 | ......(4.34) |
 , is increased. This causes a
positive increment in the growth rate as anticipated earlier. Even in
a subsaturated liquid for which
c∞<cS this increment could
cause the sign of dR/dt to change and become positive. Thus Equation
4.27 allows us to quantify the bubble growth rate due to
rectified mass diffusion.
If an oscillating pressure is applied to a fluid consisting
of a subsaturated or saturated liquid and seeded with
microbubbles of radius, RE, then
Expression 4.34 also demonstates that there will exist
a certain critical or threshold amplitude above which the microbubbles
will begin to grow by rectified diffusion. This threshold amplitude,
 C, will be large enough so that the value of
Γ3/Γ2 is sufficiently small to
make Expression
4.34 vanish. From Equations 4.29 to 4.33 the
threshold amplitude becomes
 | ......(4.35) |
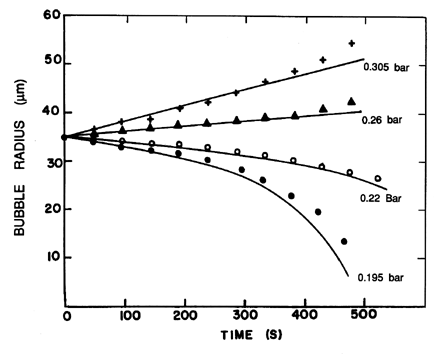
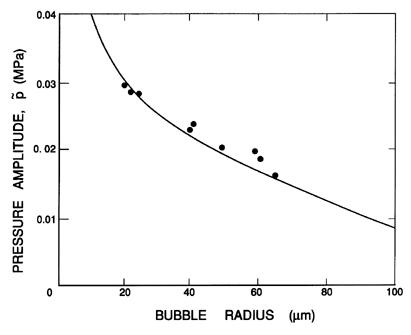
Typical experimental measurements of the rates of growth and of the threshold pressure amplitudes are shown in Figures 4.11 and 4.12. The data are from the work of Crum (1980, 1984) and are for distilled water that is saturated with air. It is clear that there is satisfactory agreement for the cases shown. However, Crum also observed significant discrepancies when a surface-active agent was added to the water to change the surface tension.
|
| Figure 4.11 Examples from Crum (1980) of the growth (or shrinkage) of air bubbles in saturated water (S=68dynes/cm) due to rectified diffusion. Data is shown for four pressure amplitudes as shown. The lines are the corresponding theoretical predictions. |
|
| Figure 4.12 Data from Crum (1984) of the threshold pressure amplitude for rectified diffusion for bubbles in distilled water (S=68dynes/cm) saturated with air. The frequency of the sound is 22.1kHz. The line is the prediction of Equation 4.35. |
Finally, we note again that most of the theories assume spherical symmetry and that departure from sphericity could alter the diffusion boundary layer in ways that could radically affect the mass transfer process. Furthermore, there is some evidence that acoustic streaming induced by the excitation can also cause disruption of the diffusion boundary layer (Elder 1959, Gould 1966).
Before leaving the subject of rectified diffusion, it is important to emphasize that the bubble growth that it causes is very slow compared with most of the other growth processes considered in the last two chapters. It is appropriate to think of it as causing a gradual, quasistatic change in the equilibrium size of the bubble, RE. However, it does provide a mechanism by which very small and stable nuclei might grow sufficiently to become nuclei for cavitation. It is also valuable to observe that the Blake threshold pressure, p∞c, increases as the mass of gas in the bubble, mG, increases (see Equation 2.46). Therefore, as mG increases, a smaller reduction in the pressure is necessary to create an unstable bubble. That is to say, it becomes easier to cavitate the liquid.
4.10 BJERKNES FORCES
A different nonlinear effect is the force experienced by a bubble in an acoustic field due to the finite wavelength of the sound waves. The spatial wavenumber will be denoted by k=ω/cL. The presence of such waves implies an instantaneous pressure gradient in the liquid. To model this we substitute
 | ......(4.36) |
 * is the amplitude of the sound waves
and xi
is the direction of wave propagation.
Like any other pressure gradient, this produces an instantaneous force,
Fi, on the bubble in the xi direction given by
 | ......(4.37) |
 | ......(4.38) |
 , is given by Equation
4.3 so that
 | ......(4.39) |
 | ......(4.40) |
 | ......(4.41) |
The form of the primary Bjerknes force produces some interesting bubble migration patterns in a stationary sound field. Note from Equation 4.41 that if the excitation frequency, ω, is less than the natural frequency, ωN, (or RE<RR) then the primary Bjerknes force will cause migration of the bubbles away from the nodes in the pressure field and toward the antinodes (points of largest pressure amplitude). On the other hand, if ω>ωN (or RE>RR) the bubbles will tend to migrate from the antinodes to the nodes. A number of investigators (for example, Crum and Eller 1970) have observed the process by which small bubbles in a stationary sound field first migrate to the antinodes, where they grow by rectified diffusion until they are larger than the resonant radius. They then migrate back to the nodes, where they may dissolve again when they experience only small pressure oscillations. Crum and Eller (1970) and have shown that the translational velocities of migrating bubbles are compatible with the Bjerknes force estimates given above.
Finally, it is important to mention one other nonlinear effect. An acoustic field can cause time-averaged or mean motions in the fluid itself. These are referred to as acoustic streaming. The term microstreaming is used to refer to such motions near a small bubble. Generally these motions take the form of circulation patterns and, in a classic paper, Elder (1959) observed and recorded the circulating patterns of microstreaming near the surface of small gas bubbles in liquids. As stated earlier, these circulation patterns could alter the processes of heat and mass diffusion to or from a bubble and therefore modify phenomena such as rectified diffusion.
- Apfel, R.E. (1981). Acoustic cavitation prediction. J. Acoust. Soc. Am., 69, 1624--1633.
- Birnir, B. and Smereka, P. (1990). Existence theory and invariant manifolds of bubble clouds. Comm. Pure Appl. Math., 43, 363--413.
- Bjerknes, V. (1909). Die Kraftfelder. Friedrich Vieweg and Sohn, Braunsweig.
- Blake, F.G. (1949a). The onset of cavitation in liquids. Acoustics Res. Lab., Harvard Univ., Tech. Memo. No. 12.
- Blake, F.G. (1949b). Bjerknes forces in stationary sound fields. J. Acoust. Soc. Am., 21, 551.
- Borotnikova, M.I. and Soloukin, R.I. (1964). A calculation of the pulsations of gas bubbles in an incompressible liquid subject to a periodically varying pressure. Sov. Phys. Acoust., 10, 28--32.
- Chapman, R.B. and Plesset, M.S. (1971). Thermal effects in the free oscillation of gas bubbles. ASME J. Basic Eng., 93, 373--376.
- Cole, R.H. (1948). Underwater explosions. Princeton Univ. Press, reprinted by Dover in 1965.
- Crum, L.A. (1979). Tensile strength of water. Nature, 278, 148--149.
- Crum, L.A. (1980). Measurements of the growth of air bubbles by rectified diffusion. J. Acoust. Soc. Am., 68, 203--211.
- Crum, L.A. (1983). The polytropic exponent of gas contained within air bubbles pulsating in a liquid. J. Acoust. Soc. Am., 73, 116--120.
- Crum, L.A. (1984). Rectified diffusion. Ultrasonics, 22, 215--223.
- Crum, L.A. and Eller, A.I. (1970). Motion of bubbles in a stationary sound field. J. Acoust. Soc. Am., 48, 181--189.
- Devin, C. (1959). Survey of thermal, radiation, and viscous damping of pulsating air bubbles in water. J. Acoust. Soc. Am., 31, 1654--1667.
- Elder, S.A. (1959). Cavitation microstreaming. J. Acoust. Soc. Am., 31, 54--64.
- Eller, A.I. and Flynn, H.G. (1965). Rectified diffusion during non-linear pulsation of cavitation bubbles. J. Acoust. Soc. Am., 37, 493--503.
- Eller, A.I. (1969). Growth of bubbles by rectified diffusion. J. Acoust. Soc. Am., 46, 1246--1250.
- Eller, A.I. (1972). Bubble growth by diffusion in an 11kHz sound field. J. Acoust. Soc. Am., 52, 1447--1449.
- Eller, A.I. (1975). Effects of diffusion on gaseous cavitation bubbles. J. Acoust. Soc. Am., 57, 1374-1378.
- Esche, R. (1952). Untersuchung der Schwingungskavitation in Flüssigkeiten. Acustica, 2, AB208--AB218.
- Flynn, H.G. (1964). Physics of acoustic cavitation in liquids. Physical Acoustics, 1B. Academic Press.
- Gould, R.K. (1966). Heat transfer across a solid-liquid interface in the presence of acoustic streaming. J. Acoust. Soc. Am., 40, 219--225.
- Hsieh, D.-Y. and Plesset, M.S. (1961). Theory of rectified diffusion of mass into gas bubbles. J. Acoust. Soc. Am., 33, 206--215.
- Knapp, R.T., Daily, J.W., and Hammitt, F.G. (1970). Cavitation. McGraw-Hill, New York.
- Kumar, S. and Brennen, C.E. (1993). Some nonlinear interactive effects in bubbly cavitation clouds. J. Fluid Mech., 253, 565--591.
- Lauterborn, W. (1976). Numerical investigation of nonlinear oscillations of gas bubbles in liquids. J. Acoust. Soc. Am., 59, 283--293.
- Lauterborn, W. and Suchla, E. (1984). Bifurcation superstructure in a model of acoustic turbulence. Phys. Rev. Lett., 53, 2304--2307.
- Neppiras, E.A. (1969). Subharmonic and other low-frequency emission from bubbles in sound-irradiated liquids. J. Acoust. Soc. Am., 46, 587--601.
- Neppiras, E.A. (1980). Acoustic cavitation. Phys. Rep., 61, 160--251.
- Neppiras, E.A. and Noltingk, B.E. (1951). Cavitation produced by ultrasonics: theoretical conditions for the onset of cavitation. Proc. Phys. Soc., London, 64B, 1032--1038.
- Noltingk, B.E. and Neppiras, E.A. (1950). Cavitation produced by ultrasonics. Proc. Phys. Soc., London, 63B, 674--685.
- Parlitz, U., Englisch, V., Scheffczyk, C., and Lauterborn, W. (1990). Bifurcation structure of bubble oscillators. J. Acoust. Soc. Am., 88, 1061--1077.
- Pfriem, H. (1940). Akust. Zh., 5, 202--212.
- Plesset, M.S. and Prosperetti, A. (1977). Bubble dynamics and cavitation. Ann. Rev. Fluid Mech., 9, 145--185.
- Prosperetti, A. (1974). Nonlinear oscillations of gas bubbles in liquids: steady state solutions. J. Acoust. Soc. Am., 56, 878--885.
- Prosperetti, A. (1977a). Application of the subharmonic threshold to the measurement of the damping of oscillating gas bubbles. J. Acoust. Soc. Am., 61, 11--16.
- Prosperetti, A. (1977b). Thermal effects and damping mechanisms in the forced radial oscillations of gas bubbles in liquids. J. Acoust. Soc. Am., 61, 17--27.
- Prosperetti, A. (1982). Bubble dynamics: a review and some recent results. Appl. Sci. Res., 38, 145--164.
- Prosperetti, A. (1984). Bubble phenomena in sound fields: part one and part two. Ultrasonics, 22, 69--77 and 115--124.
- Prosperetti, A., Crum, L.A. and Commander, K.W. (1988). Nonlinear bubble dynamics. J. Acoust. Soc. Am., 83, 502--514.
- Safar, M.H. (1968). Comments on papers concerning rectified diffusion of cavitation bubbles. J. Acoust. Soc. Am., 43, 1188--1189.
- Skinner, L.A. (1970). Pressure threshold for acoustic cavitation. J. Acoust. Soc. Am., 47, 327--331.
- Smereka, P., Birnir, B. and Banerjee, S. (1987). Regular and chaotic bubble oscillations in periodically driven pressure fields. Phys. Fluids, 30, 3342--3350.
- Smereka, P. and Banerjee, S. (1988). The dynamics of periodically driven bubble clouds. Phys. Fluids, 31, 3519--3531.
- Strasberg, M. (1961). Rectified diffusion: comments on a paper of Hsieh and Plesset. J. Acoust. Soc. Am., 33, 359.
- Young, F.R. (1989). Cavitation. McGraw-Hill Book Company.
Last updated 12/1/00.
Christopher E. Brennen